vovo to [email protected]English • 7 months agoThe decline of sex in filmslemmy.dbzer0.comimagemessage-square258fedilinkarrow-up1185
arrow-up1185imageThe decline of sex in filmslemmy.dbzer0.comvovo to [email protected]English • 7 months agomessage-square258fedilink
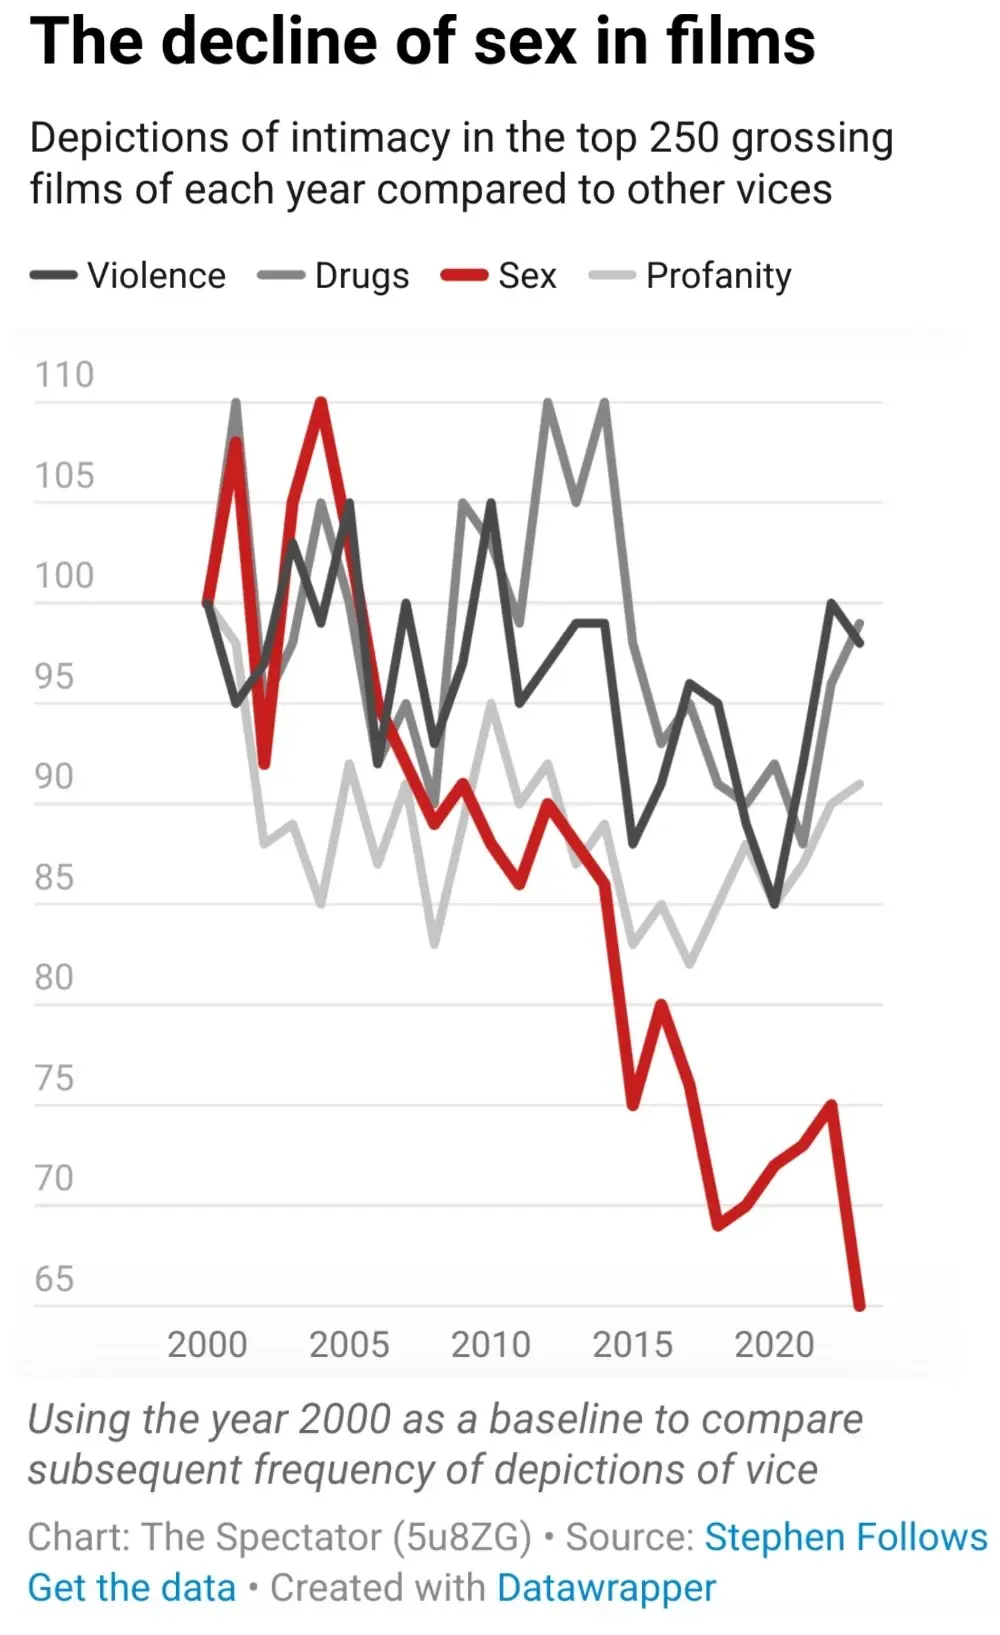
minus-squarevovoOPlinkfedilinkEnglish1•edit-26 months agoYou can’t read the chart like that. Everything starts with 100. It shows the decrease/increase of each vice separately.

You can’t read the chart like that. Everything starts with 100. It shows the decrease/increase of each vice separately.
Oh, % of year 2000 values, ok I get now.