@[email protected] to [email protected] • 2 years agoThis is not a forecast for 50 years time, it’s happening today.lemmy.worldimagemessage-square208fedilinkarrow-up11.33Kcross-posted to: [email protected]
arrow-up11.29KimageThis is not a forecast for 50 years time, it’s happening today.lemmy.world@[email protected] to [email protected] • 2 years agomessage-square208fedilinkcross-posted to: [email protected]
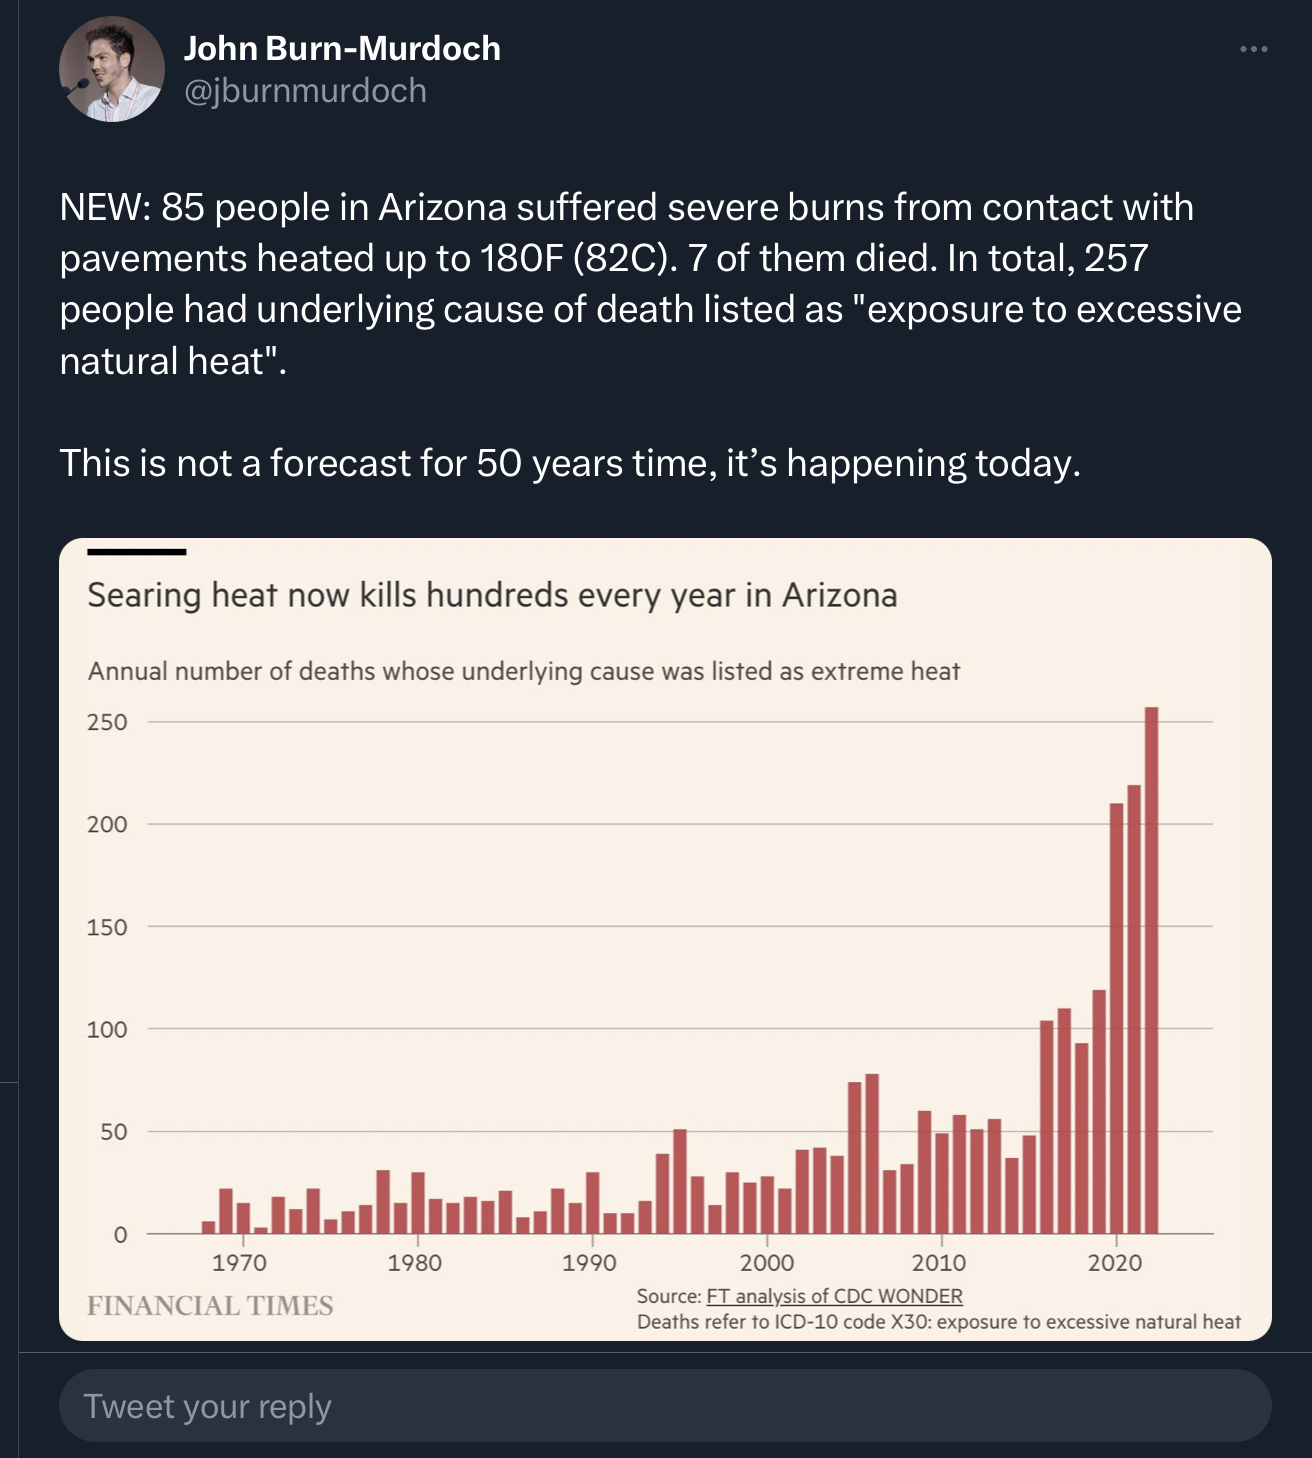
minus-squarePatFustylinkfedilink-8•2 years agoThis graph also looks like the number of opioid deaths. I there is a jump of fentanyl deaths starting in 2010 and i wonder if this is related
minus-squaretrainsaresexylinkfedilink2•2 years agoI looked up news articles after seeing the graph. Seems to be more about elderly and homeless. People touching knobs or falling on the concrete and receiving burns is a thing, but it’s trending way up. Like 83C concrete… crazy hot.
minus-squarePatFustylinkfedilink0•2 years agoThe only reason why i said opioid is that i wss thinking people who live on the streets who are one something dont feel shit. Elderly makes sense too.

This graph also looks like the number of opioid deaths. I there is a jump of fentanyl deaths starting in 2010 and i wonder if this is related
deleted by creator
I looked up news articles after seeing the graph. Seems to be more about elderly and homeless. People touching knobs or falling on the concrete and receiving burns is a thing, but it’s trending way up. Like 83C concrete… crazy hot.
The only reason why i said opioid is that i wss thinking people who live on the streets who are one something dont feel shit. Elderly makes sense too.