
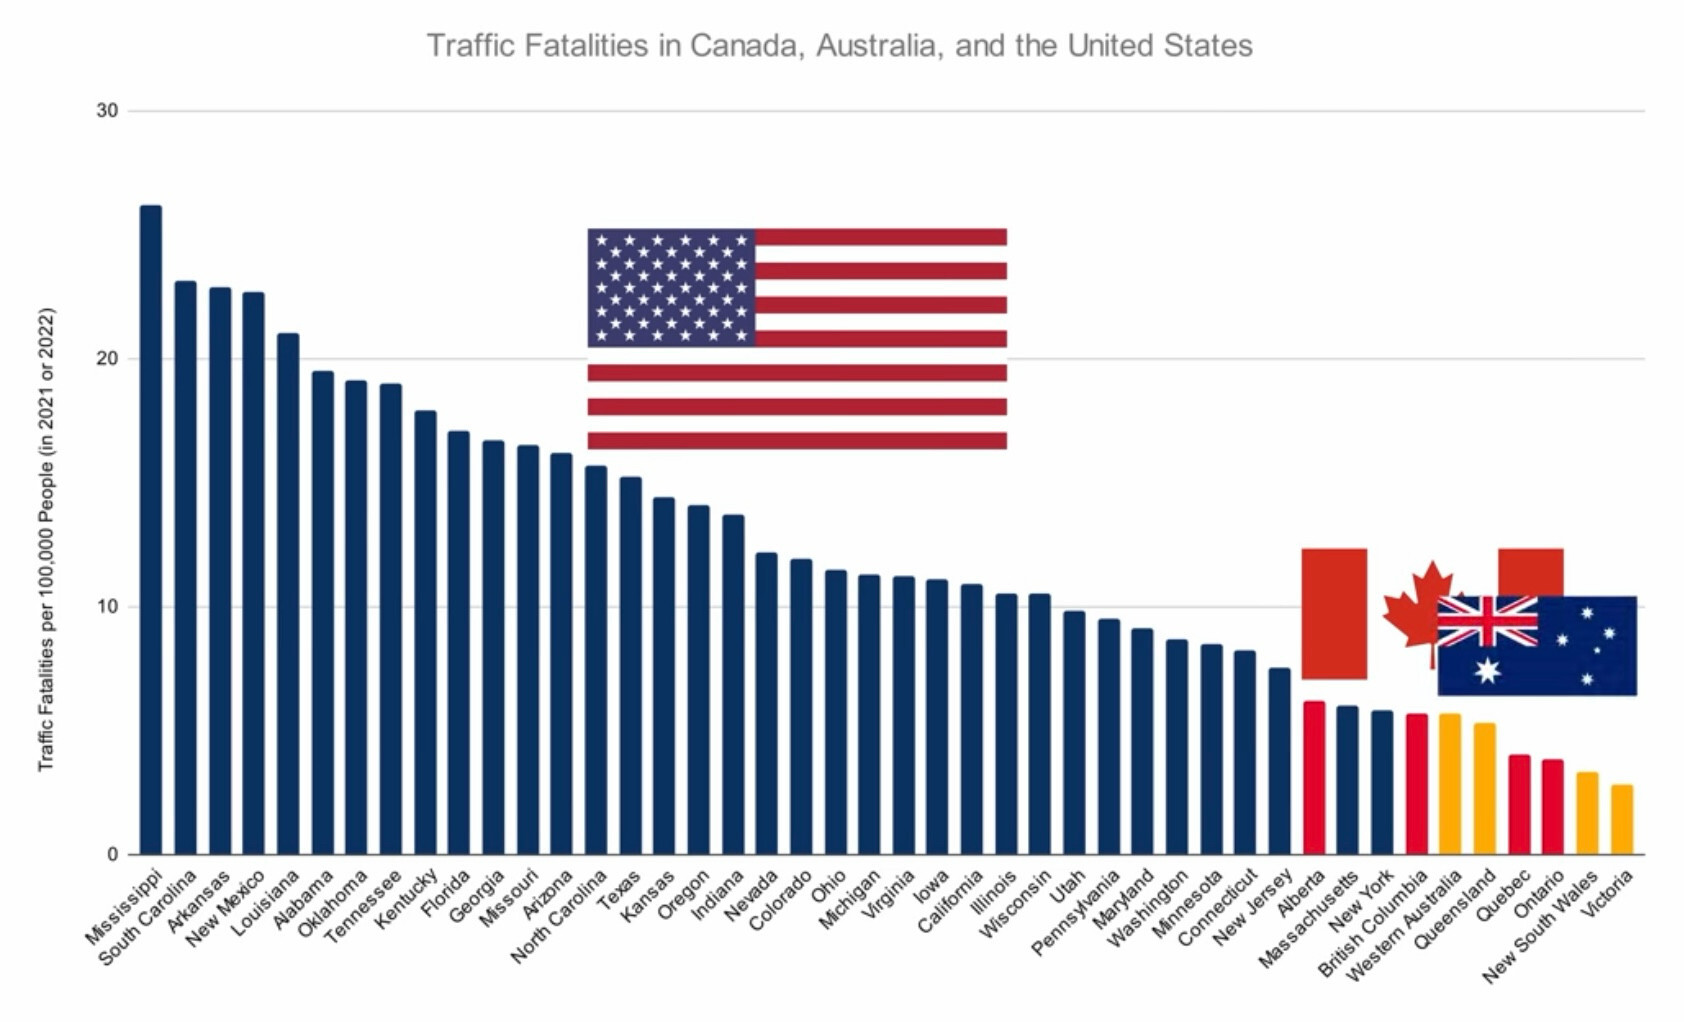
Mississippi is always the worst of any statistic
I understand this is largely due to Americans wanting to get drunk like everyone else but also having to drive everywhere.
And gigantic motor vehicles.
And terrible roads and/or regulations? I can’t help but notice the worst offenders are conservative areas and those usually are neglectful.
The transportation departments of red states just funnel the monies to corrupt buddies and nothing gets fixed even though there is perpetual road work being (performatively) done.
And lack of pedestrian infrastructure, and…, and… We can go on and on at how baked into the cake these deaths are in the car cult.
There are so many dumb regulations and circumstances that functionally push people to giant vehicles.
For instance: I replaced my 2016 VW golf base model with an electric F150 this year for a multitude of reasons. I got a refund from insurance (with the same coverage). None of this makes sense except that I’m less likely to be injured by other motorists in my 3.5ton truck. I found this depressing.
The fact that California, a state with THIRTEEN TIMES MORE PEOPLE than Mississippi, has less than half the number of traffic fatalities is mind blowing. Mississippi is just 30% of the landmass that California represents, and yet it gets more than double the amount of traffic fatalities.
Looking at the left side of the graph, the trend is easily recognizable. Drunk angry and repressed, poverty stricken republicans will drive drunk like it’s the right to bear arms. The further right you go, the more democratic the state.
just to be clear, this is per capita. not actual totals.
But they have more people per capita! Because they’re so much bigger, see?
Thought it would be interesting to compare with EU, they published an article in 2023 (https://ec.europa.eu/eurostat/statistics-explained/index.php?oldid=630784) with the following data. This graph uses a number per 1 million inhabitants so divide by 10 to compare it.

As far as I know Finland has the world’s strictest driving licence, so I’m actually surprised to see it posting worse statistics than Sweden here.
Sweden went insane with road security in the nineties (nollvisionen?) so maybe that’s why.
Sweden is as expected. 200-something fatalities for 10 million people. Norway stands out😃
It got me thinking about definitions, though. For Sweden every death during transportation is counted (including busses, heavy trucks and single accidents with a bike), while the definition my 2 minute googling found for Canada said deaths resulting from accidents involving automobiles.
The stats are normalised for per 1 million inhabitants are they not?
But your second point is definitely very good. I imagine getting consistent fully comparable numbers from all the various countries isn’t easy.
Need to factor in terrain and weather conditions too.
How is norway so low?? We have mostly trash roads with a few noteable exceptions. Cliff on one side, river or fjord on the other. No shoulder worth mentioning unlike sweeden, that often have half a lane on either side of the road.
Ok, noted: New York is almost on par with civilized regions.
That might be skewed as most of their population are in New York City, and more than half of the city doesn’t even own a car.
That’s pretty much the point of the chart. Better public infrastructure decrease the deaths from cars.
Or commuting accidents in traffic are rarely fatal.
America is more in the middle of the road when you look at the whole globe, and don’t just select a few counties with lower death rates.
https://en.wikipedia.org/wiki/List_of_countries_by_traffic-related_death_rate
Africa is currently the reigning champ for vehicle related deaths.
The Netherlands has 4.19
The Netherlands is close in size to Maryland, and close in the number of inhabitants as New York. Also half of the traffic is cars and half is bicycles. It’s pretty insane how bad Mississippi is.
I tried looking into why Mississippi was so far worse. Mostly just finding people self report texting and driving more there, infrastructure is shitty, enforcement is shitty, DUIs are high they recently just upped the civil fine of texting while driving from $25 to $100.
For fun I looked to see what Mississippi would be like if it was its own country, and do to GDP it was compared to Morocco and Kenya.
Car Deaths per 100,000
Mississippi: 26 Morocco: 17.29 Kenya: 28
Kenya is 4x as dense as Mississippi is though, so still hard to say Mississippi is safer than Kenya. It’s just numbers
I think it’s fair to compare like with like. Many African countries have poor infrastructure, inadequate enforcement of traffic laws, rapid urbanization, unsafe vehicles, and limited emergency medical services. Its easy for a Western country to look better compared to that, but is it a fair comparison?
Well, if you’re comparing the US south, it might be fitting.
That’s not fair. Blue state tax pays have paid for some really nice infrastructure down there.
Took a closer look to see if I was surprised by any correlation about poverty, and browsed away with the belief that the south is still a shithole… which might still correlate with poverty. I think kansas/oregon is the first entry that wouldn’t be ‘south.’
Drinkin’ beers an’ drivin’ yer trukk is a highly traditional pastime in the US deep south. Typically done in the middle of the night, in my experience, for the maximum probability of contacting the local wildlife or making friends at high speed with a tree.
New Jersey is too low. Serious doubts about the validity of this table.
It’s comparing against total population, not driving population, so any amount of mass transit will greatly reduce this number
Probably not. The state has been implementing Vision Zero as a statewide program along with several cities.
The two major highways have lower than average accidents due to design.
One of the state’s signature traffic configurations, the Jersey Jughandle, eliminates left turn movements on older highways, a major source of accidents.
How you know this is good data
- No sources. Just a chart.
- Randomly compares some places in North American to some places in Australia.
Where are Idaho, Wyoming and Montana?
There are only 36 states represented here by my count. It says “major” states, whatever that means. But 14 in total are missing either because of their smaller populations, or because their fatality rate is low enough that they would fall off the right hand side of the chart and thus wouldn’t fit the “America Drivers Bad” narrative quietly being implied, here.
Edit: I looked up the numbers for my state in the same year (and no, I’m not telling the public which one). We would be at 1.2 on this chart if my math is correct, which is well below even the shortest bar for Victoria, there.
I decided to look and found that this metric is almost always measured by vehicle distance travelled rather than by population. Basically the graph OP shared is useless and meant to support a narrative, as you stated.
I think it’s kinda interesting still, in that it shows people are (must?) drive so much. But yes, agree that per cap seems like the wrong statistic for any kind of safety.
Maybe more fair would be transit fatalities per mile traveled (any method)?
Yes. The preferred method is per distance travelled.
Does that mean that Canadians in Alberta, Quebec, and Ontario simply don’t drive long distances inside their provinces? That doesn’t track with what I’ve seen when visiting all three provinces.
Calgary relatives: “oh I’m just going to zip up to Edmonton for the day” or go for a coffee 40km to the other side of town or just do the daily 130km commute etc.
For AB I’m thinking its more “I can’t afford to live in Banff, but that’s where work is so a place in Canmore is where I call home with a 30 min commute each way.”
Or “Yeah I like living in Red Deer, but it means a 1.5 hour drive one way if I want to see the Flames beat the skates off the Leafs when they’re in town.”
Yep, all of that too: Okotoks and Airdrie are basically suburbs now.
While I’d prefer to see every state and province represented, I imagine only metro areas matter here anyway. The dangers of the road are quite different when your largest city has a sliver of density compared to the rest, though by that token, density is probably a factor that even large states should account for (which would probably put NYC very low on the list lol)
SOUTH CAROLINA #2!!! 🥳🥳🎉🎊🎉🎉🎊🍻🥳🎉🎉🪅
The south is killing it!
Not surprised by SC, as a Canadian I had one accident in 40 years of driving, it was in SC, caused by a 17yo girl driving an old suburban or something.
I’d like to see the % of trucks vs cars for each location.
USA #1! 🇺🇸🦅🇺🇸


